10 SEO KPIs Marketers Should Track Every Month
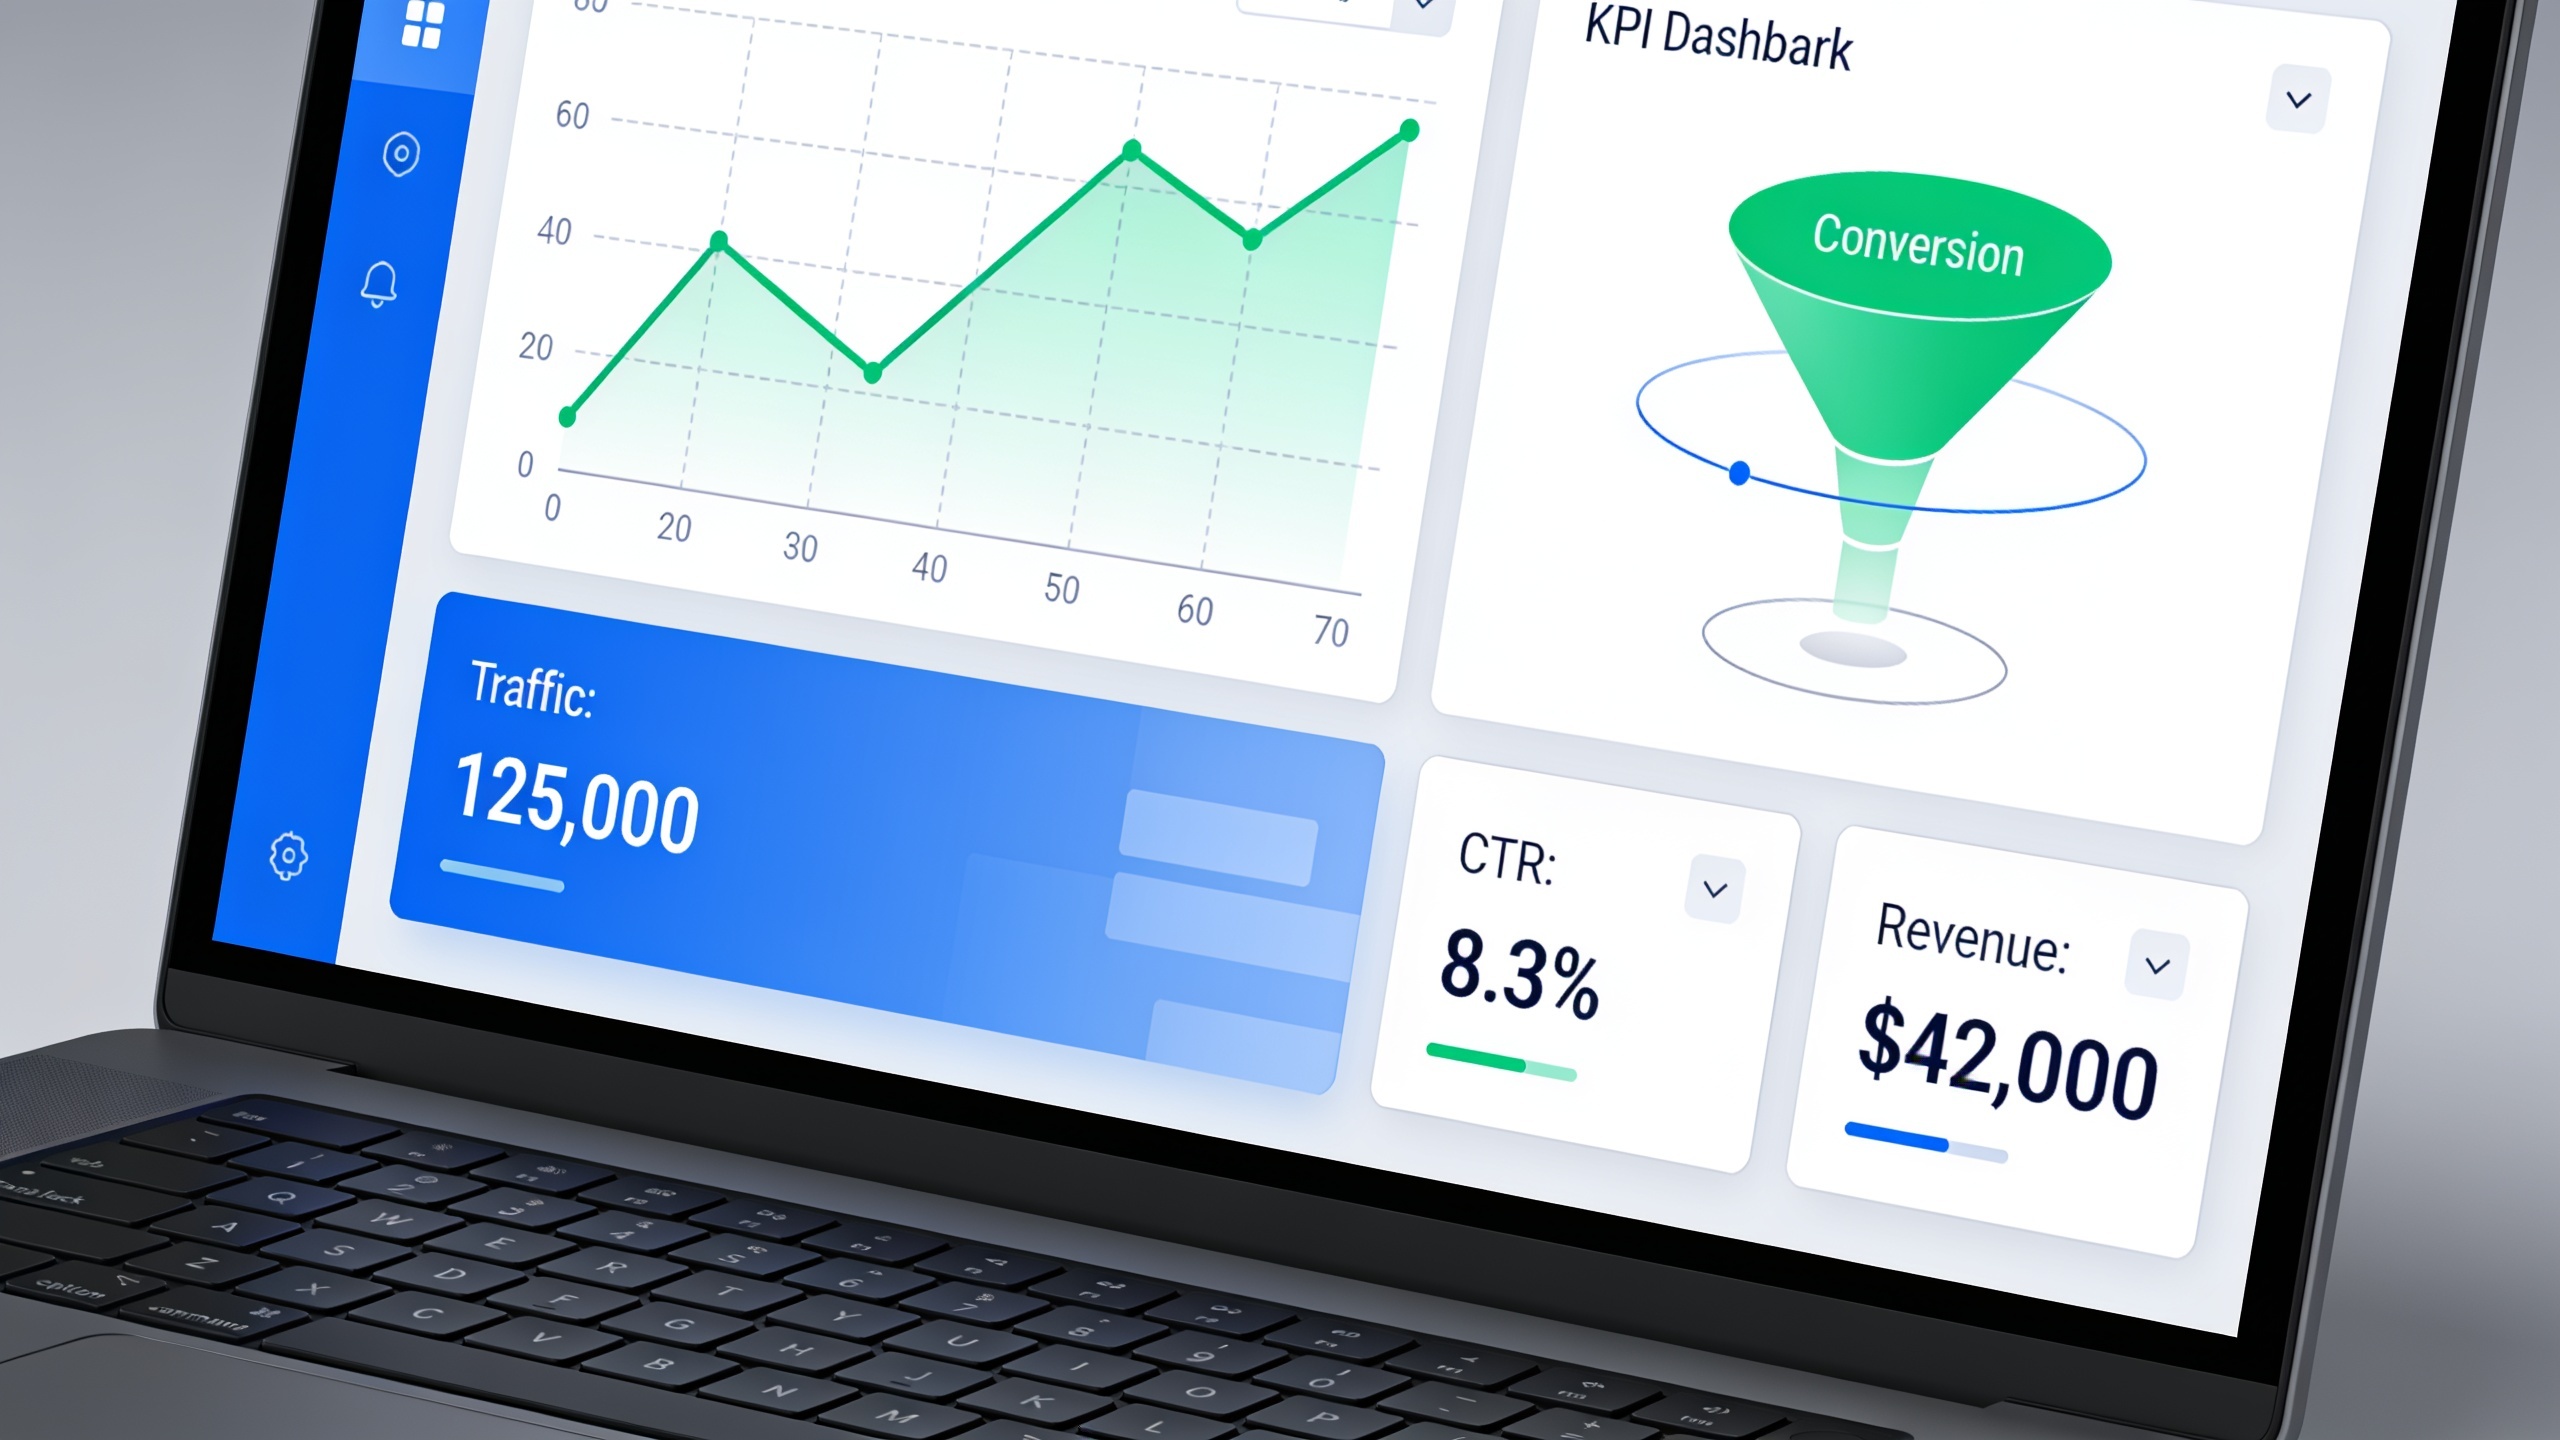
Get the mix right and that annoyingly vague question ("so, how's SEO going?") turns into a real answer. You can point at traffic trends, conversions, and technical health all in one place. So in this piece I'm going to walk through the 10 KPIs I think are worth checking every single month, what each one actually tells you, and how to build a reporting habit that doesn't require a full analytics department to keep alive.
Table of Contents
- What Are SEO KPIs, and Why Bother Tracking Them Monthly?
- The 10 SEO KPIs Worth Watching Every Month
- Building a Monthly Reporting Habit That Actually Sticks
- Tools That Do the Job Without Hiring Anyone
- The Mistakes That Quietly Wreck Your Reports
- FAQ: SEO KPIs and Monthly Reporting
What Are SEO KPIs, and Why Bother Tracking Them Monthly?
SEO KPIs are the specific, measurable numbers, things like organic sessions, click-through rate, and organic conversion rate, that tell you whether your SEO work is producing real business outcomes. Rankings alone can't do that. KPIs connect what you see in the search results to the stuff stakeholders actually care about: traffic, engagement, and money.
Here's the difference in plain terms. A ranking tells you where a page sits for a query on a given day. Useful, but on its own it's kind of hollow. You can rank #3 for a keyword nobody searches, or sit at #1 and still get barely any clicks because your snippet reads like a tax form. KPIs fill in that gap. They measure what happens after the ranking, whether people click, whether they hang around, whether they do the thing you wanted them to do.
And doing this monthly (instead of only when something breaks or a client starts asking pointed questions) pays off in a few ways. You catch problems early, like a sudden indexation drop, before they quietly cost you three months of traffic. You build a paper trail that proves SEO is actually feeding the pipeline, which is exactly what you want on hand when someone's eyeing your budget with a red pen. And over time you develop a feel for the patterns, seasonal dips, algorithm hits, content going stale, before any of it becomes a fire.
Why monthly and not weekly or quarterly? Weekly is just noise. Search data bounces around day to day and you'll drive yourself crazy reacting to it. Quarterly is too slow, problems compound before you ever spot them. Monthly is the sweet spot for most sites, honestly.
The 10 SEO KPIs Worth Watching Every Month
These ten cover the whole funnel, from how many people find you in search, to whether they click, to whether they convert, plus the technical signals that decide if your content is even findable in the first place. Together they paint a picture that rankings never could.
1. Organic Sessions (Organic Traffic)
Organic sessions measure the total visits to your site that came from unpaid search results, usually pulled straight from Google Analytics 4. This is your foundation metric. If sessions are flat or sliding while you're busy publishing new content, something's off, whether it's your strategy, your indexation, or a technical gremlin nobody's noticed yet.
Track it at the site level for your monthly trend line, but don't stop there. Segment by landing page and by device. Mobile versus desktop can tell you whether growth is broad or just concentrated in a couple of lucky pages.
2. Organic Click-Through Rate (CTR)
Organic CTR is the percentage of people who actually click your listing after seeing it in search, calculated as clicks divided by impressions. You'll find it in Google Search Console under the Performance report.
What it really tells you is how compelling your title and meta description are relative to where you rank. Say a page sits at position 4 but has a weirdly low CTR compared to its neighbors. That's a big flashing sign that the snippet needs work, a punchier title, a clearer meta description, maybe some schema markup that changes how the result looks. Small fixes here can move traffic without you touching the ranking at all.
3. Average Position and Keyword Rankings Distribution
Average position shows the mean ranking of your pages across the keywords they show up for. But honestly, the more useful version of this is a rankings distribution, how many keywords sit in positions 1-3, 4-10, and 11-20. Again, Search Console or a dedicated rank tracker will give you this.
Why the distribution matters more: watching keywords creep from page two onto page one tells you your work is compounding, even before those keywords bring in real traffic on their own. It's a leading indicator. Momentum you can see.
4. Organic Conversion Rate
Organic conversion rate is the percentage of organic sessions that finish a defined goal, a form fill, a demo request, a purchase, a newsletter signup, whatever you're chasing. If I had to pick one KPI for proving business value, this is it. It ties traffic straight to outcomes, no hand-waving required.
And here's the thing people miss: a site can grow sessions every single month and still be underperforming if conversion rate is dropping. Usually that means one of two problems, you're ranking for the wrong keywords (traffic quality) or your landing pages have a broken conversion path. For a real example of what happens when someone optimizes this on purpose, the case study on how a legal services firm tripled organic leads shows how matching content topics to buyer intent moved the needle in a way you could actually measure.
5. Indexation Rate
Indexation rate is the percentage of the URLs you want indexed that Google has actually indexed and made eligible to show up. Check it in Search Console's Page Indexing report, which splits your indexed pages from the excluded ones ("crawled, currently not indexed," duplicate content, all that).
A low or dropping indexation rate is a canary in the coal mine. If new content isn't getting indexed, none of the other nine KPIs matter, because that content is invisible. It doesn't exist as far as search is concerned. This one's especially worth watching if you publish a lot.
6. Crawl Stats and Crawl Budget Efficiency
Crawl stats show how often and how thoroughly Googlebot is poking around your site, and you'll find them in Search Console's Crawl Stats report. Crawl budget is just the finite amount of crawling attention Google decides to hand your site.
For most small and mid-sized sites, crawl budget isn't something you need to sweat. But if you're running a big site, or one drowning in low-value URLs (filtered category pages, tag archives, endless thin duplicates), it's worth a monthly glance to make sure Googlebot is spending its time where it counts instead of wandering off into the junk corners of your site.
7. Organic Revenue and Assisted Conversions
Organic revenue attributes actual sales or pipeline value to organic search sessions, usually through e-commerce tracking in GA4 or a CRM integration if you're doing B2B lead attribution. Assisted conversions catch the times organic search played a supporting role in a conversion that closed through some other channel.
This is the one that turns an SEO report into a business report. Even a small, steady bump in organic revenue month over month makes a far better case for continued investment than any ranking screenshot ever will. Numbers with dollar signs get attention. That's just how it works.
8. Backlink Growth (Referring Domains)
Backlink growth tracks new referring domains, the unique websites linking to yours, added each month. It's still one of the more durable ranking factors out there. You'll measure it through tools that crawl the link graph, most commonly using something like a Domain Rating (DR) from providers like Ahrefs.
But don't just count total links. Track referring domains and their quality, because a handful of relevant, higher-authority links beats a pile of junk ones nearly every time. If you'd rather build this deliberately than sit around hoping links show up on their own, a manually reviewed link exchange network like RobinRank lets you request a placement from a real site owner and offer one back, and it verifies the live link actually went up. RobinRank requires a minimum Domain Rating of 5 (via Ahrefs) and reviews every site by hand before it lands in its Discover network. It's free to start with a 7-day trial after you're approved, then moves to a paid plan.
9. Content Engagement Metrics
Content engagement metrics, average engagement time, scroll depth, pages per session, show whether the people landing from organic search actually read and interact with your page or bounce straight off. GA4 reports these under the Engagement section by default.
Low engagement on a page that ranks well and gets clicks is a bad sign. Usually it means a mismatch between what the searcher expected and what you gave them, and over time search engines can read that as "weak result" and knock you down for it. Engagement is also where slow or bloated images come back to bite you, pages with poorly optimized visuals tend to see higher bounce rates, which is exactly why the tactics in 5 image SEO tips that actually move the needle are worth a look when you're doing a monthly content audit.
Want content like this running on autopilot for your own site? Try RobinRank free — AI-written, SEO-optimized articles generated and published automatically, no credit card required.
10. Core Web Vitals and Technical Health Score
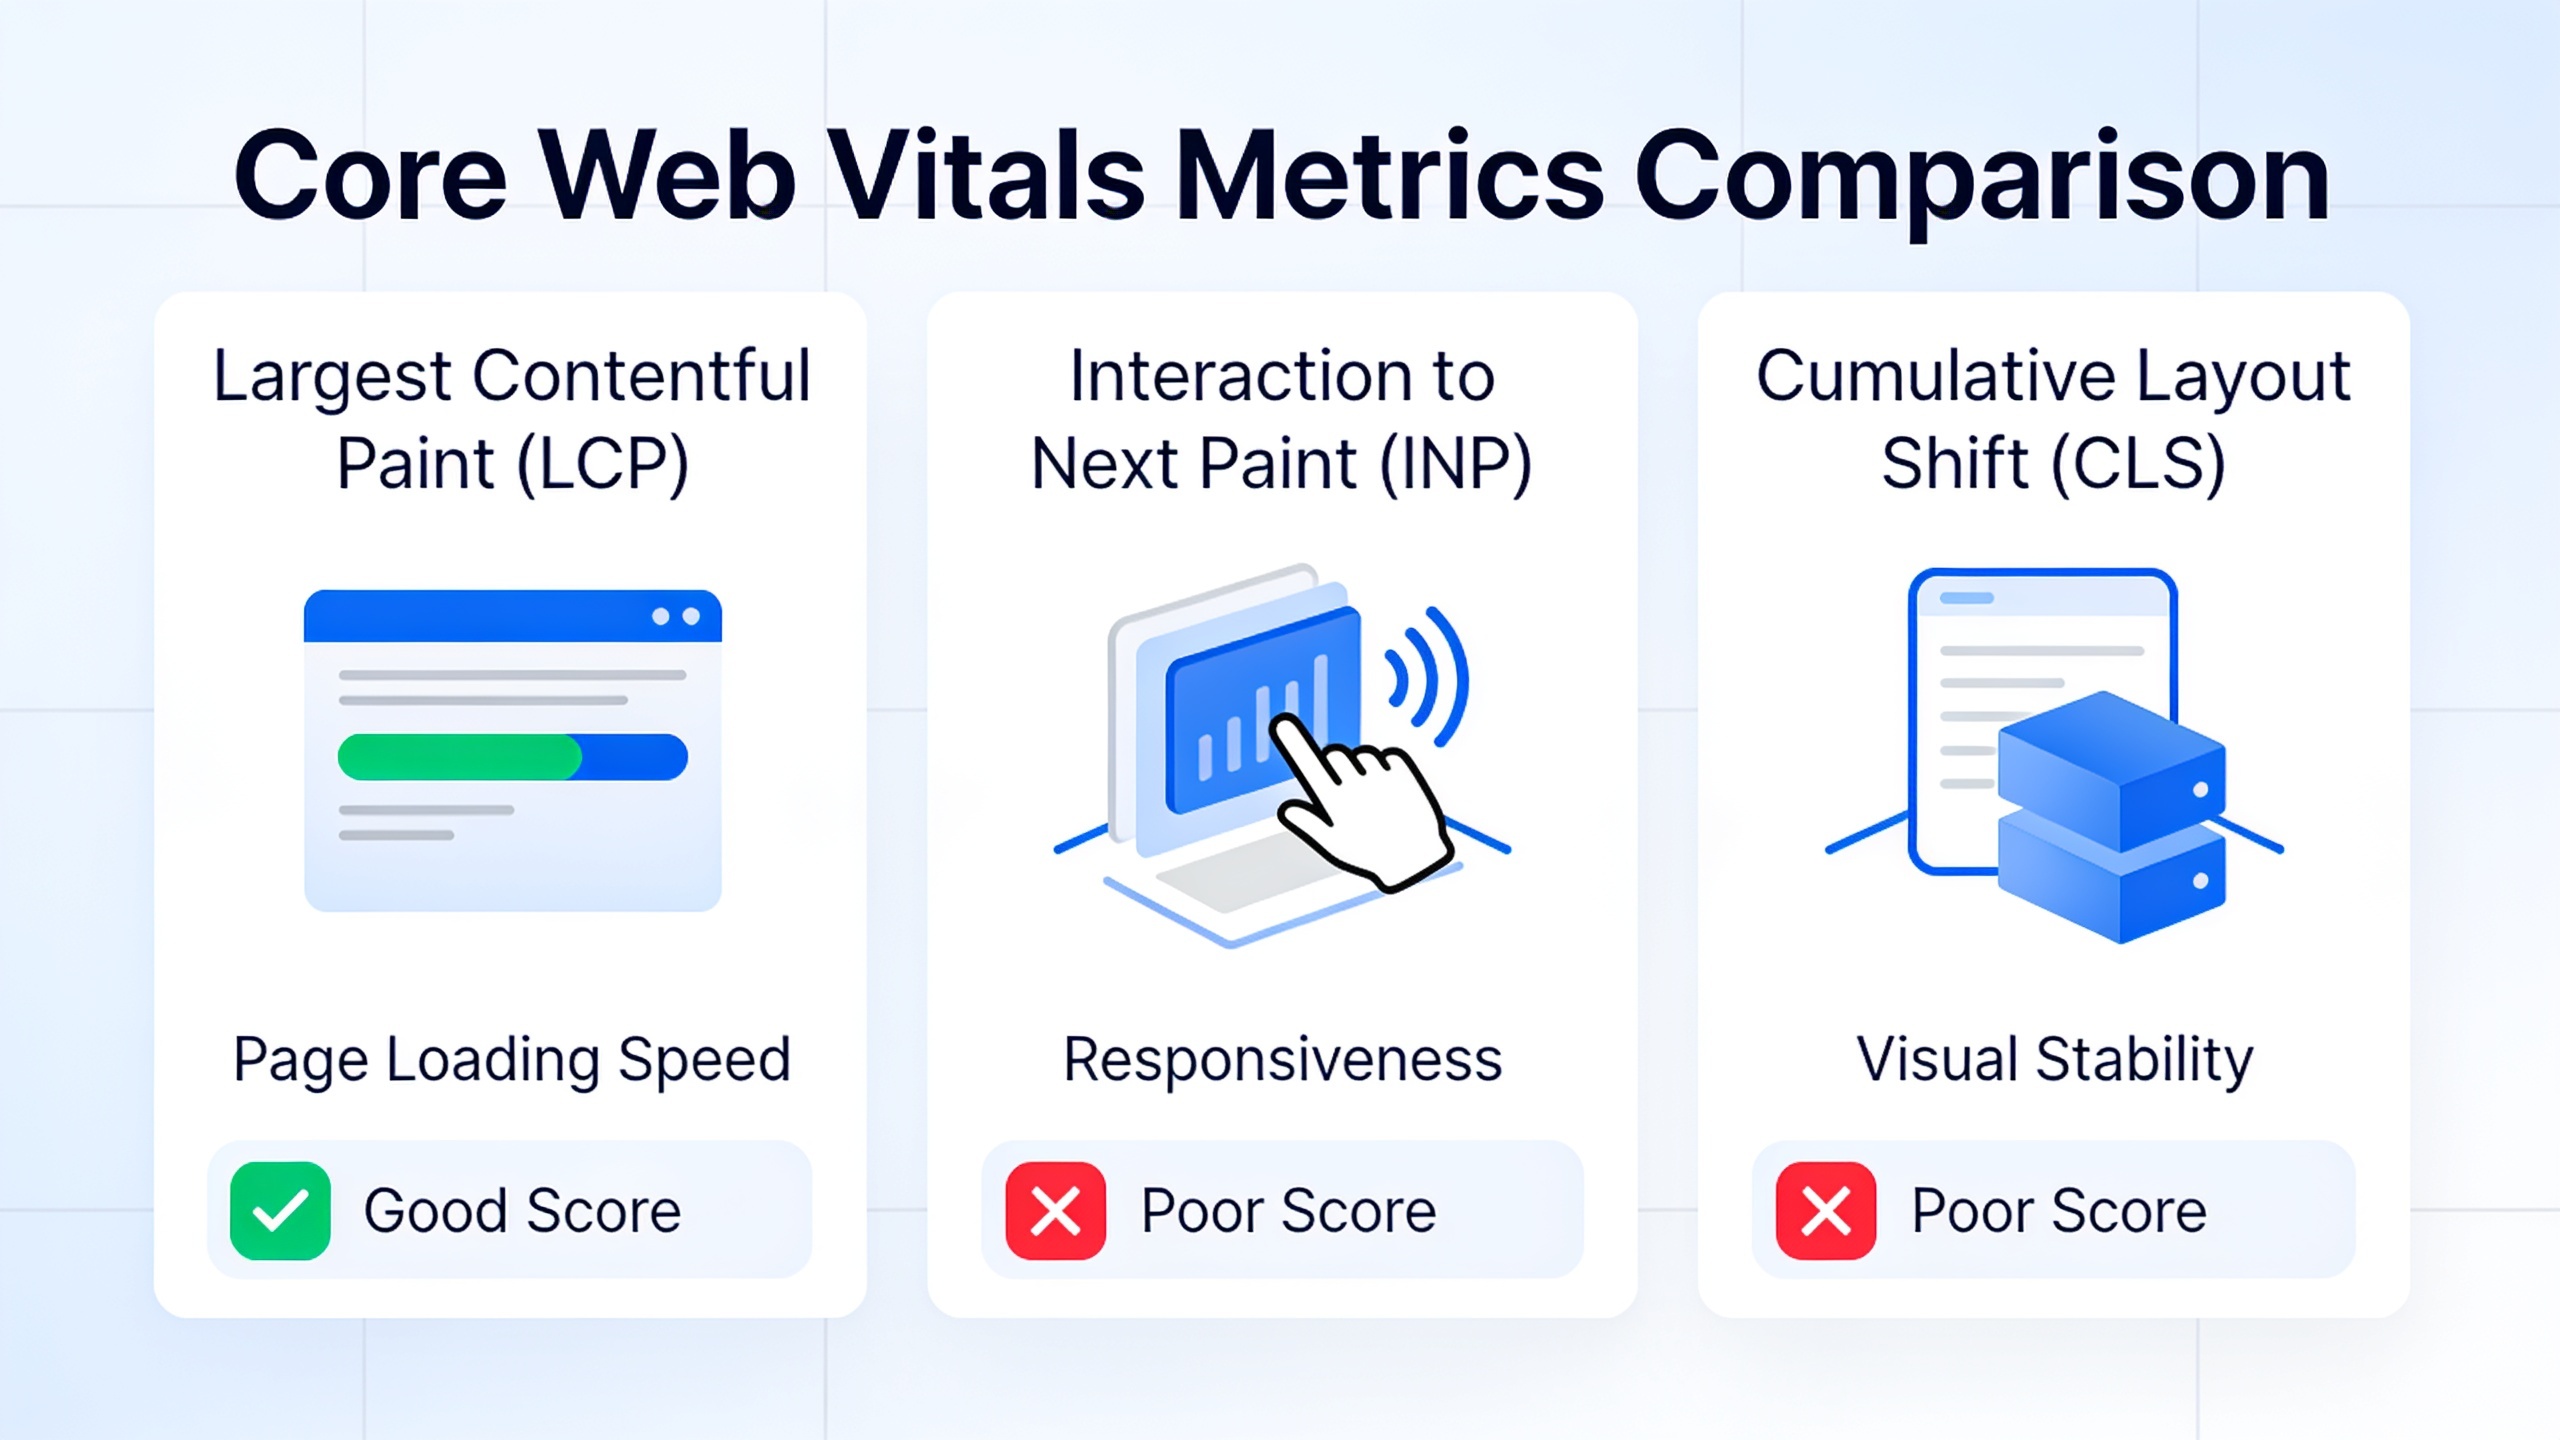
Core Web Vitals are Google's page experience metrics, Largest Contentful Paint (LCP), Interaction to Next Paint (INP), and Cumulative Layout Shift (CLS), which measure loading speed, responsiveness, and visual stability. You'll find them in Search Console's Core Web Vitals report and in PageSpeed Insights.
Technical health score is the bigger umbrella, folding in Core Web Vitals along with crawl errors, broken links, and mobile usability. Checking this monthly catches the sneaky stuff early. A new page template, a giant unoptimized image, one rogue third-party script, any of these can quietly tank your site speed and nobody notices until traffic starts dropping. Ask me how I know.
Building a Monthly Reporting Habit That Actually Sticks
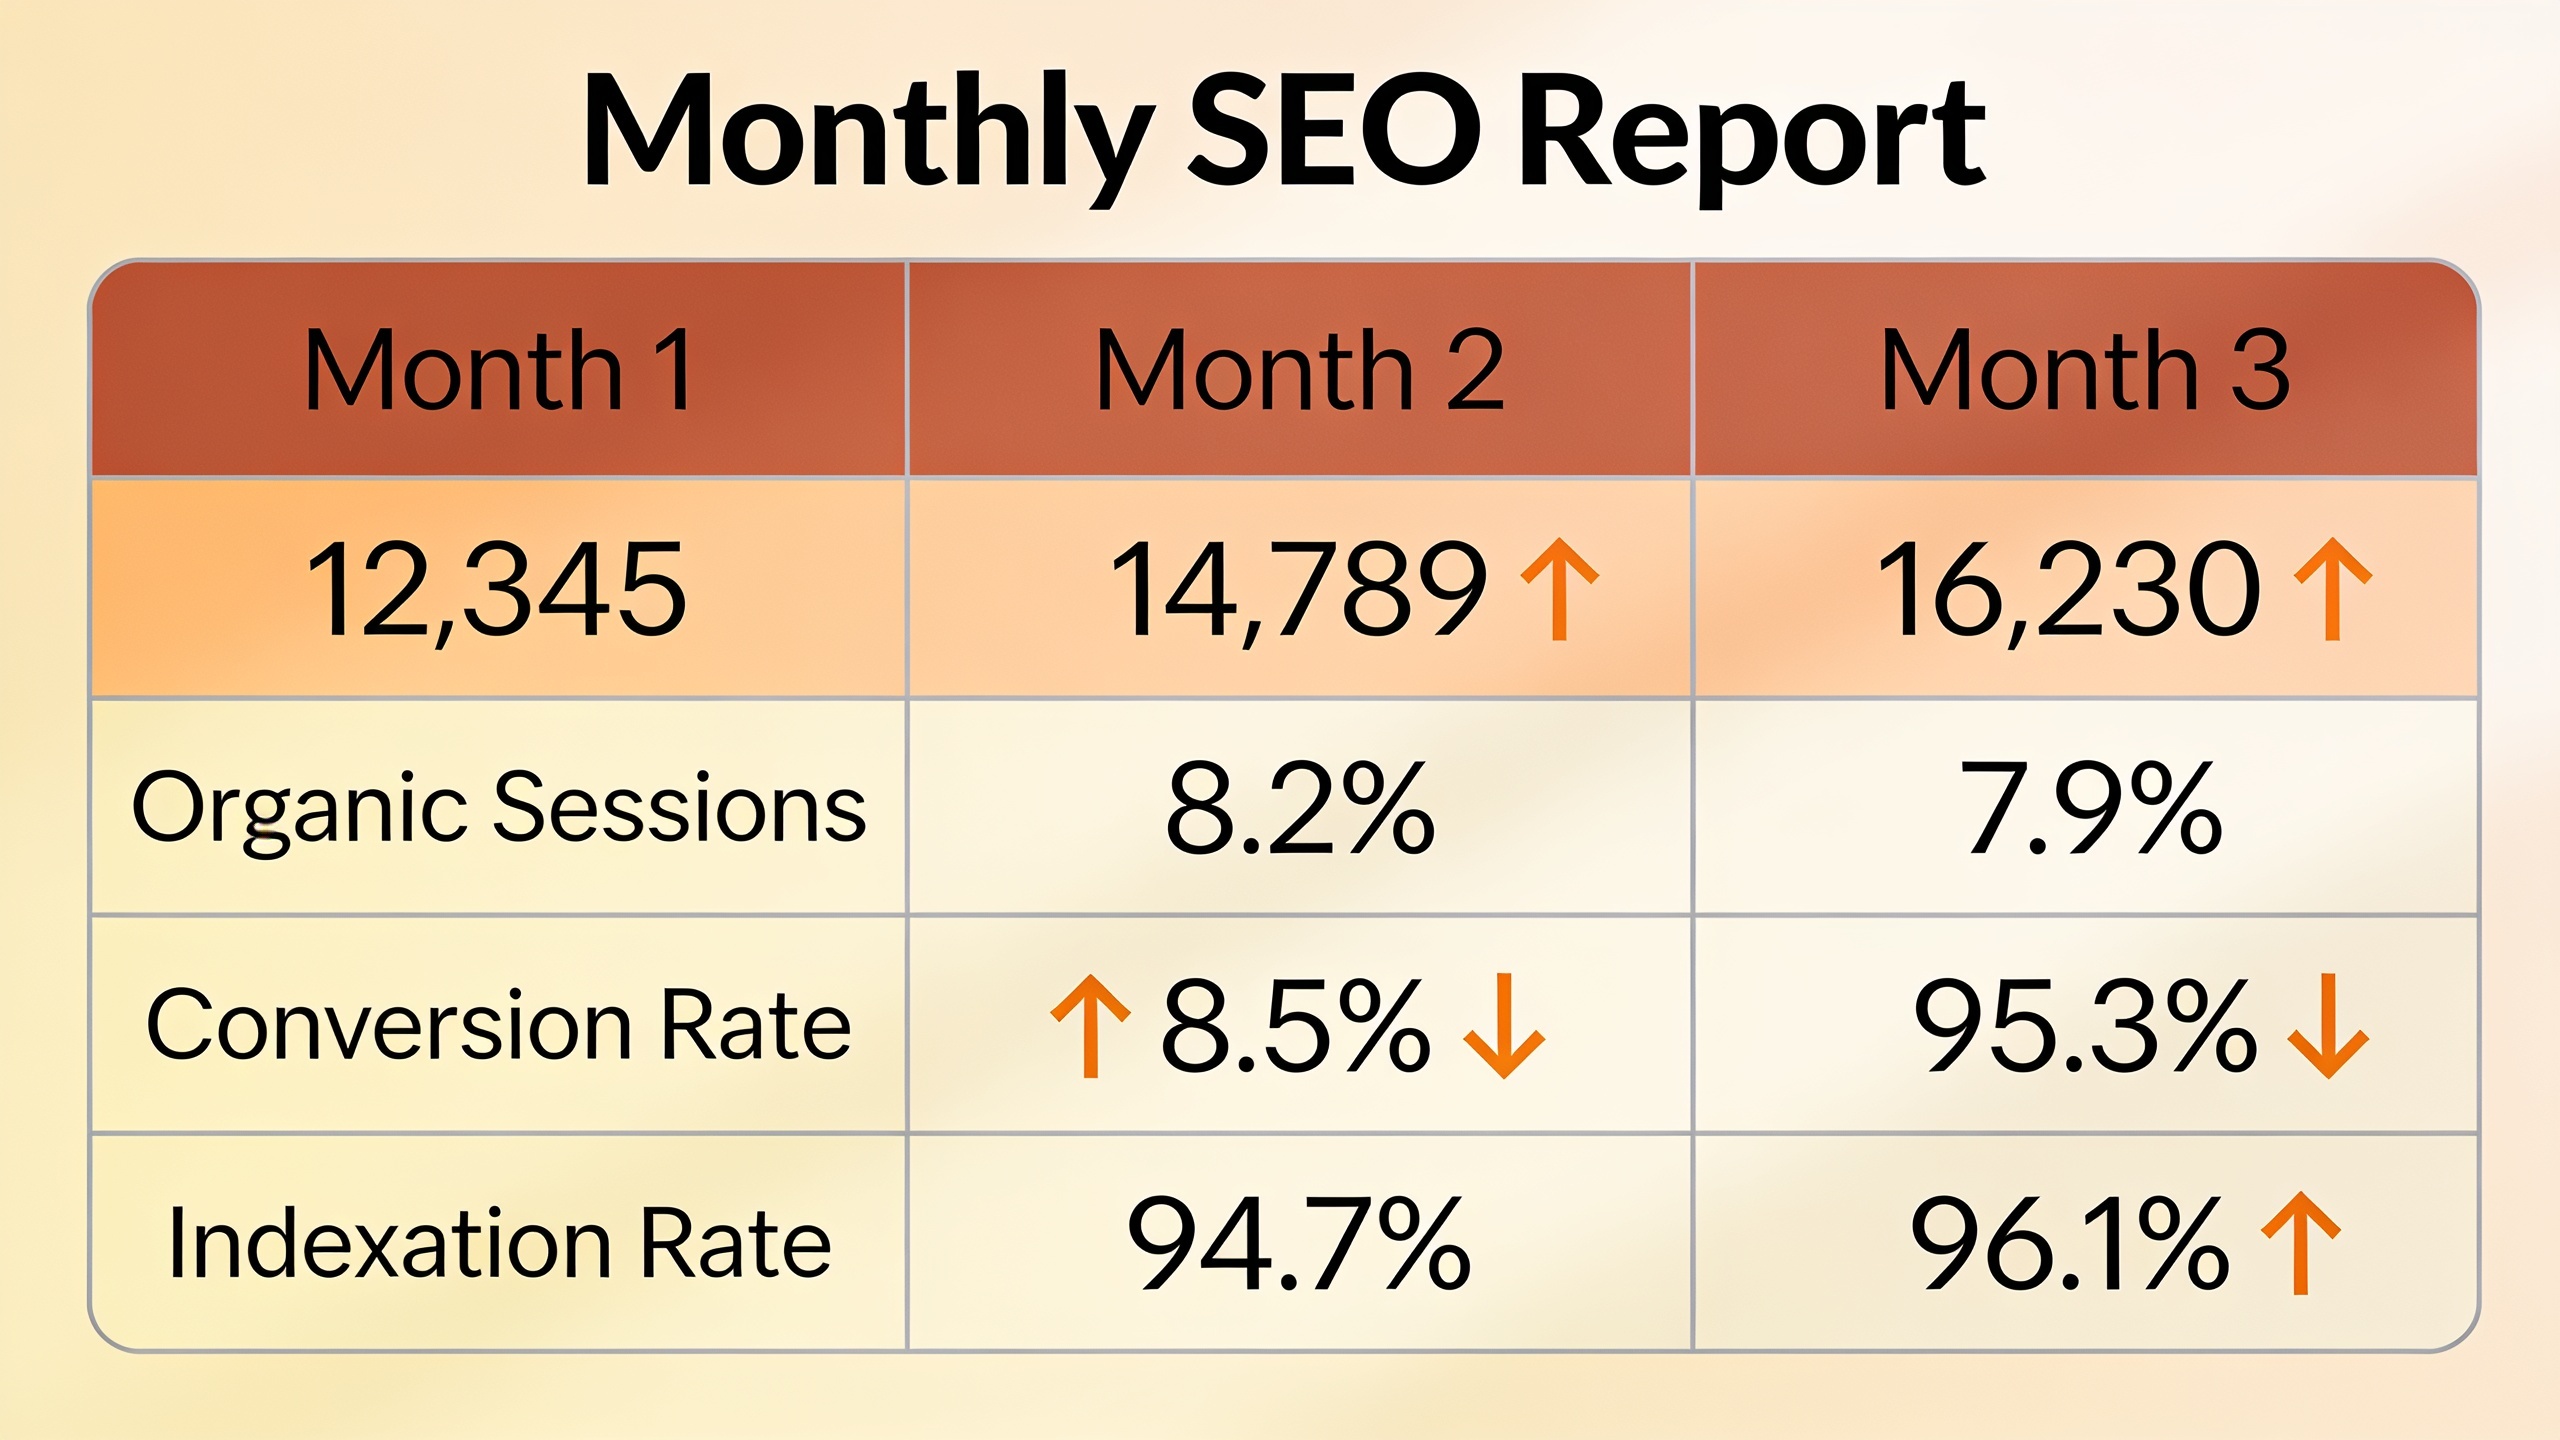
A sustainable monthly reporting habit comes down to three things: a fixed date, a short and consistent set of metrics, and a template you reuse instead of rebuilding every time. The goal is not a 40-slide deck that nobody reads. It's a snapshot that takes an hour to make and five minutes to skim.
Pick a fixed reporting date. The first business day of the month works nicely because it captures a full previous calendar month from GA4 and Search Console. (Search Console lags a few days, so pulling on day one or two of the new month usually gets you complete coverage of the month before.)
Cap it at 8-10 metrics. Use the ten above as your checklist, then trim to what matters for your goals. An e-commerce site leans hard on organic revenue and conversion rate. A content publisher probably cares more about sessions, engagement, and indexation. Don't drag every metric into every report just because you can.
Show trend, not a snapshot. A single month's number floating in isolation is basically useless. Every metric should show at least the trailing three months so people can see direction, not just a dot on a page.
Add one sentence of context per metric. Numbers with no interpretation get ignored, every time. Something like "Organic sessions grew 8% month over month, mostly from /blog/pricing-guide after we rewrote the title tag" tells a story a chart never could.
And don't wait for the report to flag emergencies. If indexation or crawl stats crater mid-month, send a quick alert. Sitting on that for three weeks until the scheduled report is how small problems become big ones.
| Reporting Element | What to Include | Frequency |
|---|---|---|
| Traffic overview | Organic sessions, CTR, average position | Monthly |
| Conversion snapshot | Organic conversion rate, organic revenue | Monthly |
| Technical health check | Indexation rate, crawl stats, Core Web Vitals | Monthly |
| Off-page progress | New referring domains, backlink quality notes | Monthly |
| Anomaly alerts | Sudden drops in indexation, crawl errors, traffic | As they occur |
Tools That Do the Job Without Hiring Anyone
Most of these ten KPIs can be tracked with Google Search Console and GA4 (both free) plus one third-party tool for the backlink and rank-position data Google's own tools don't fully cover. You do not need an enterprise SEO suite to run a solid monthly report. Small teams pull this off all the time.
| SEO KPI | Where to Find It | Notes |
|---|---|---|
| Organic sessions | Google Analytics 4 | Free; segment by landing page and device |
| Organic CTR | Google Search Console (Performance report) | Free; filter by query and page |
| Average position / rankings distribution | Google Search Console or a dedicated rank tracker | Search Console is free but samples data; dedicated trackers give daily granularity |
| Organic conversion rate | Google Analytics 4 (Events/Conversions) | Requires goal or event setup |
| Indexation rate | Google Search Console (Page Indexing report) | Free; check monthly for excluded-page trends |
| Crawl stats | Google Search Console (Crawl Stats report) | Free; more relevant for larger sites |
| Organic revenue | GA4 e-commerce tracking or CRM integration | Requires proper tracking setup |
| Backlink growth / referring domains | Ahrefs, or a manual review network like RobinRank | RobinRank verifies live placements and checks a minimum Domain Rating of 5 before a site joins its network |
| Content engagement | Google Analytics 4 (Engagement report) | Free; watch scroll depth and time on page |
| Core Web Vitals | Google Search Console + PageSpeed Insights | Free; test after any template or image changes |
None of these tools do the reporting for you, though. The value isn't the dashboards. It's the discipline of pulling the same numbers into the same template every month instead of bouncing between tabs whenever a client emails.
The Mistakes That Quietly Wreck Your Reports
The single most common mistake is tracking too many metrics inconsistently instead of a focused set consistently. Reports that change format every month make trends impossible to spot, and trends are the entire point. A few other traps worth dodging:
Reporting rankings with no context. A ranking number alone tells nobody whether the business is better off. Pair it with CTR, traffic, or conversions so the "so what" is obvious.
Ignoring indexation until traffic tanks. By the time sessions drop because pages aren't indexed, you've already lost weeks of visibility. Checking the Page Indexing report monthly, even when everything seems fine, catches it early.
Treating backlinks as a vanity metric. Counting total backlinks without looking at referring domain quality can make a report look great while the actual authority signal stays soft. Quality-focused link building, including a monitored exchange approach, tends to hold up far better than volume chasing.
Skipping the "why." A report that says "traffic grew 5%" without saying which pages, keywords, or fixes drove it isn't actionable. It's just a number, and numbers with no story get ignored.
Letting technical stuff rot between reports. Core Web Vitals and crawl errors can regress silently after a site update. If you wait for the monthly report to catch it, the problem's already been live for weeks.
FAQ: SEO KPIs and Monthly Reporting
How many SEO KPIs should a monthly report include?
Most teams do best tracking 8-10 KPIs consistently rather than a longer list they update haphazardly. The ten in this article, organic sessions, CTR, rankings distribution, organic conversion rate, indexation rate, crawl stats, organic revenue, backlink growth, content engagement, and Core Web Vitals, cover the whole funnel without turning into a monster.
What's the difference between an SEO KPI and a vanity metric?
An SEO KPI ties directly to a business outcome (traffic, engagement, conversions, revenue). A vanity metric, like total keywords ranked or total backlinks, can look impressive while meaning almost nothing. The fix is usually pairing a raw count (total backlinks) with a quality signal (referring domain authority) so the number actually says something.
How is organic conversion rate different from overall site conversion rate?
Organic conversion rate isolates conversions from organic search sessions specifically, filtering out paid ads, email, direct, and social. That matters because organic traffic often has different intent than, say, paid search, so blending them can hide whether SEO is bringing in qualified visitors or not.
Why does indexation rate matter if a page already ranks well?
Because it's about the pages that aren't ranking yet. It's an early warning system. If new content keeps failing to get indexed or takes forever to show up, that usually points to technical issues, weak internal linking, thin content, crawl budget problems, that will eventually hit the whole site, not just the new stuff.
Do I need paid tools, or are the free ones enough?
Search Console and GA4 are free and cover most of these ten, including sessions, CTR, indexation rate, crawl stats, and Core Web Vitals. The main gaps are daily rank tracking at scale and detailed backlink and referring domain analysis, which is where a paid rank tracker or a link-focused platform fills in.
Look, tracking KPIs beyond rankings turns organic search from a mysterious black box into something you can actually measure and improve. The teams that build a simple, repeatable monthly habit, even a modest one covering just traffic, conversions, indexation, and links, catch problems earlier and make a much stronger case for their budget than the folks still relying on ranking screenshots. That's the whole game, really.
Ready to stop writing content by hand? Start your free RobinRank trial and get a full month of SEO-optimized articles published on autopilot.